School Calendar Shifts and Their Mark on Racetrack Crowds Plus Betting Handles
Mara Simmons · Jun 3, 2026
School Calendar Shifts and Their Mark on Racetrack Crowds Plus Betting Handles
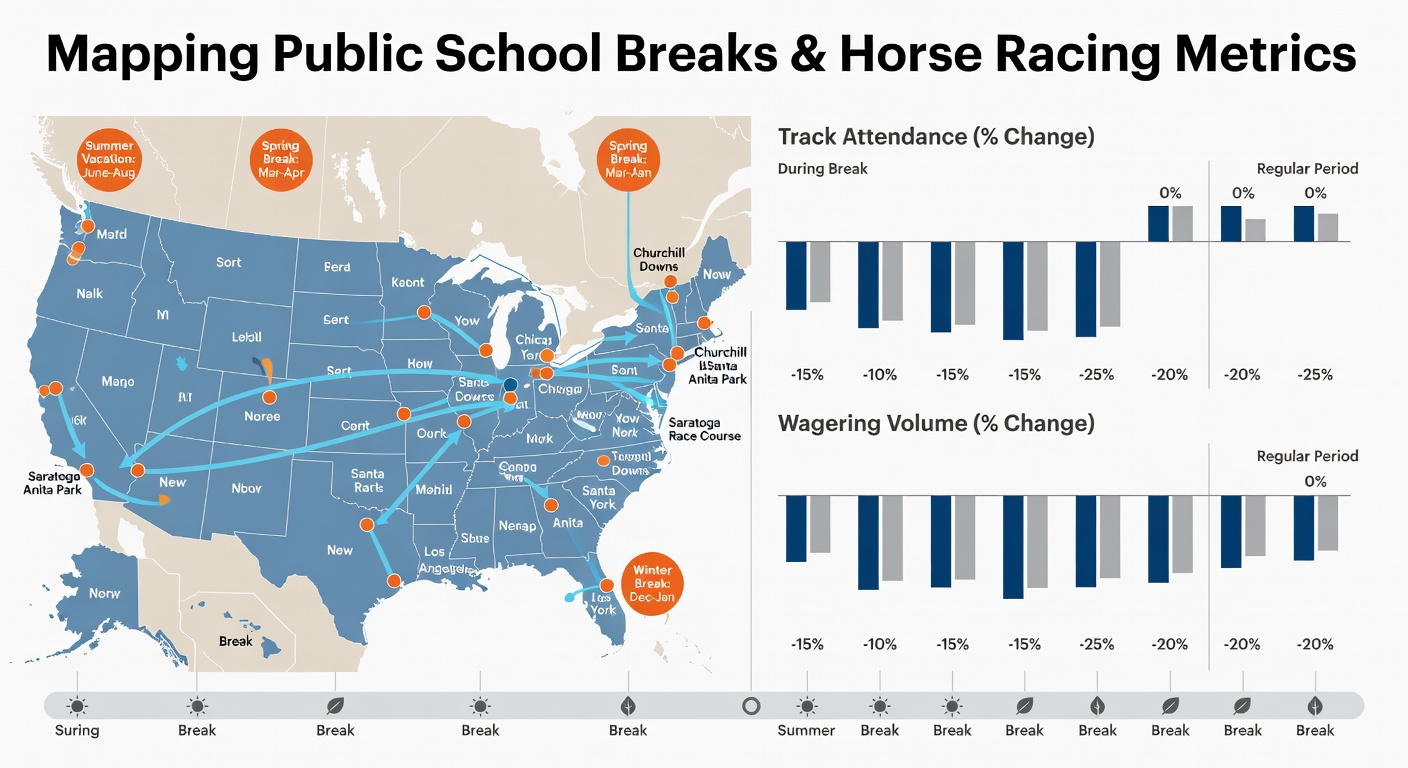
Public school calendars create predictable windows when families gain extra time away from routines, and those periods line up with measurable changes at thoroughbred and harness tracks across multiple states. Attendance figures rise when breaks open up weekday afternoons, while wagering volumes follow similar patterns because more visitors mean additional bettors at windows and self-service terminals. Data from track operators shows consistent upticks during summer recess months, with secondary spikes around winter holidays and spring breaks that vary by region. Summer recess typically runs from late May through early September in most districts, and June 2026 brought the usual influx of school-aged children and parents to daytime racing cards. Tracks in the Northeast and Midwest recorded average daily attendance gains of 12 to 18 percent compared with non-break weeks, according to internal reports compiled by regional racing associations. Those same periods produced handle increases ranging from 9 to 15 percent, driven largely by casual bettors who attend as part of family outings rather than as dedicated handicappers.Regional Calendar Variations Shape Daily Numbers
Districts in the South often release students earlier in May, while some Western states extend classes into mid-June, creating staggered waves of potential visitors. Observers note that tracks positioned near multiple school districts experience overlapping break periods that extend the elevated attendance window by several weeks. For instance, a mid-Atlantic venue drawing from both early-release and late-release zones can maintain higher gate counts from Memorial Day through the Fourth of July without interruption.
Winter breaks centered around Christmas and New Year produce shorter but sharper attendance clusters, especially on days when tracks offer special promotions aimed at families. Wagering data collected during these intervals reveals heavier play on simpler bet types such as win, place, and show, while exotic wagers see comparatively modest growth. Spring breaks, usually scattered between March and April, generate the smallest measurable lift yet still register above baseline figures in most markets.
Attendance Patterns and Bettor Demographics
Family groups account for a sizable share of the added foot traffic during breaks, and many first-time or infrequent visitors place smaller, recreational wagers. Track management teams have adjusted concession offerings and added child-friendly activities on break weeks to capture this audience segment. In turn, the broader demographic mix influences the overall handle composition, shifting emphasis toward races with large fields where novice bettors feel more comfortable selecting runners.
Quantitative Trends Across Multiple Seasons
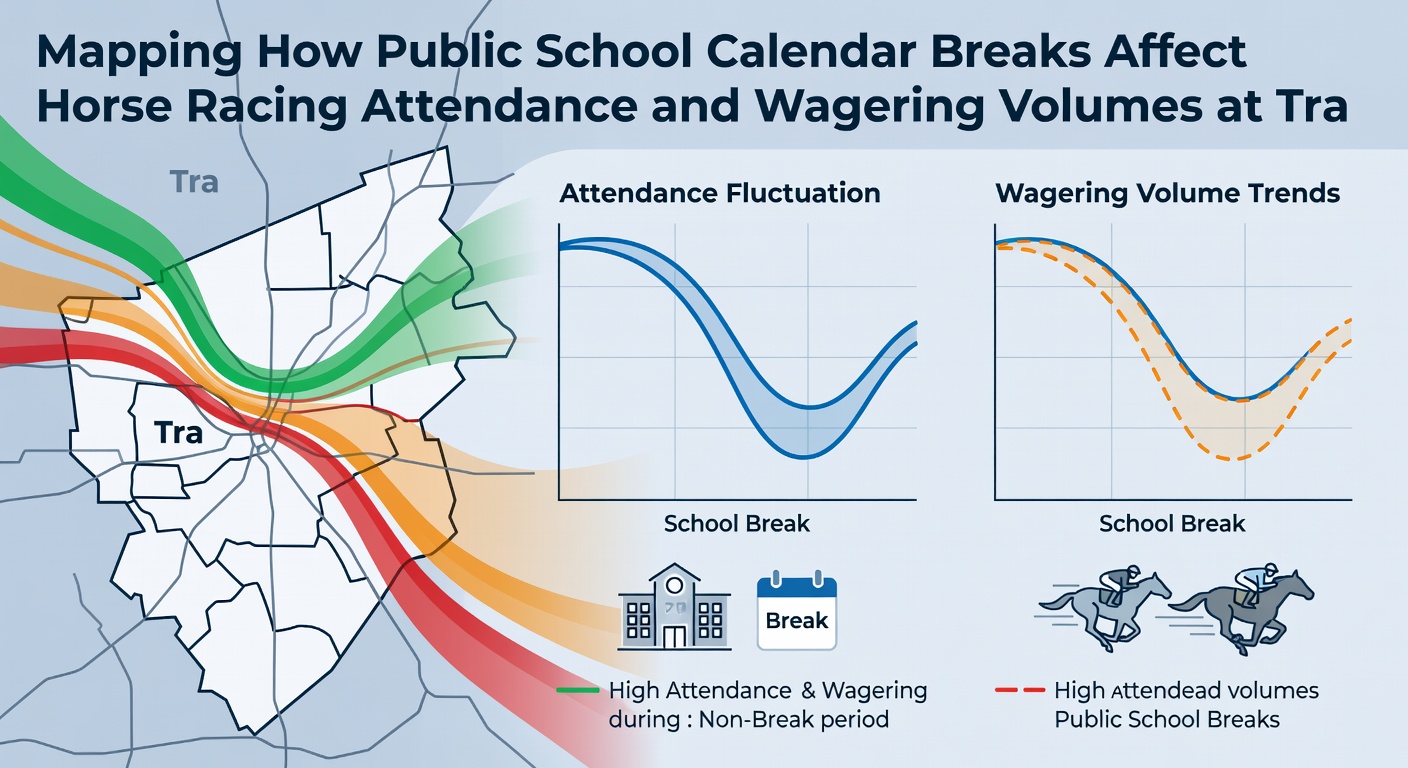
Analysis of handle reports from 2024 through early 2026 indicates that summer break weeks contribute roughly 22 percent of annual total handle at certain Midwestern tracks despite representing only 16 percent of the racing calendar. The pattern holds across both dirt and turf surfaces, though turf races sometimes show slightly higher percentage gains because casual attendees favor visual cues like grass course finishes. Researchers tracking pari-mutuel activity through the U.S. Census Bureau school enrollment datasets cross-referenced with track figures confirm that counties with higher student populations experience the strongest correlation between break timing and wagering spikes.
Evening cards held during break periods also post gains, but the effect proves less pronounced than daytime racing because many families prioritize afternoon outings. Tracks that added twilight racing in June 2026 noted attendance lifts of 7 to 11 percent on those nights, suggesting residual interest once daytime events conclude.
External Factors Interacting With Calendar Breaks
Weather conditions remain a primary variable that can amplify or mute the break-related surge. Clear, warm days during summer recess produce the largest attendance numbers, whereas rain events suppress both gate counts and handle even when schools remain closed. Promotional tie-ins such as giveaway items or concert performances scheduled on break weeks further boost participation, creating compound effects that operators now model in advance using historical school calendar data.
Transportation logistics also play a role, with tracks located near major highways or served by public transit seeing steadier visitor flows during breaks compared with more remote venues. Some facilities have partnered with school districts to offer discounted group tickets, a tactic that converts calendar-driven availability directly into measurable attendance and subsequent wagering activity.
Conclusion
Public school calendar breaks generate repeatable shifts in both attendance and handle at horse racing tracks, with summer recess delivering the largest and longest-lasting impact. Regional timing differences create staggered opportunities for tracks to prepare staffing and promotions, while demographic data shows that family-oriented visitors drive much of the added volume through simpler bet types. Continued monitoring of enrollment patterns alongside racing schedules allows operators to align resources with these predictable calendar windows.