Exploring How Seasonal Temperature Shifts Alter Performance Metrics in Professional Baseball Matchups and Influence Run Total Projections
Mara Simmons · May 18, 2026
Exploring How Seasonal Temperature Shifts Alter Performance Metrics in Professional Baseball Matchups and Influence Run Total Projections
Seasonal temperature changes reshape how baseball unfolds on the field, and researchers tracking these patterns have documented clear shifts in key performance indicators across Major League Baseball schedules, while analysts adjust run total projections accordingly as spring warmth gives way to summer heat and then cooler fall evenings. Temperature influences the physical properties of the baseball itself along with the physiological responses of players, creating measurable differences in batting averages, home run rates, and earned run averages that vary by month and region.
Temperature Effects on Ball Flight and Pitch Dynamics
Warmer air reduces air density, allowing baseballs to travel farther when hit solidly, and data from multiple seasons shows home run totals climbing as average game-time temperatures exceed 75 degrees Fahrenheit in many stadiums. Pitchers experience the opposite effect because reduced drag lets fastballs maintain velocity longer yet also makes breaking balls less sharp, which leads to higher contact rates in late innings during hotter months. Observers note that in May 2026 early season games across the central and eastern divisions already reflected these patterns with elevated scoring in afternoon contests where temperatures climbed quickly after noon.
Player Endurance and Defensive Metrics Under Shifting Conditions
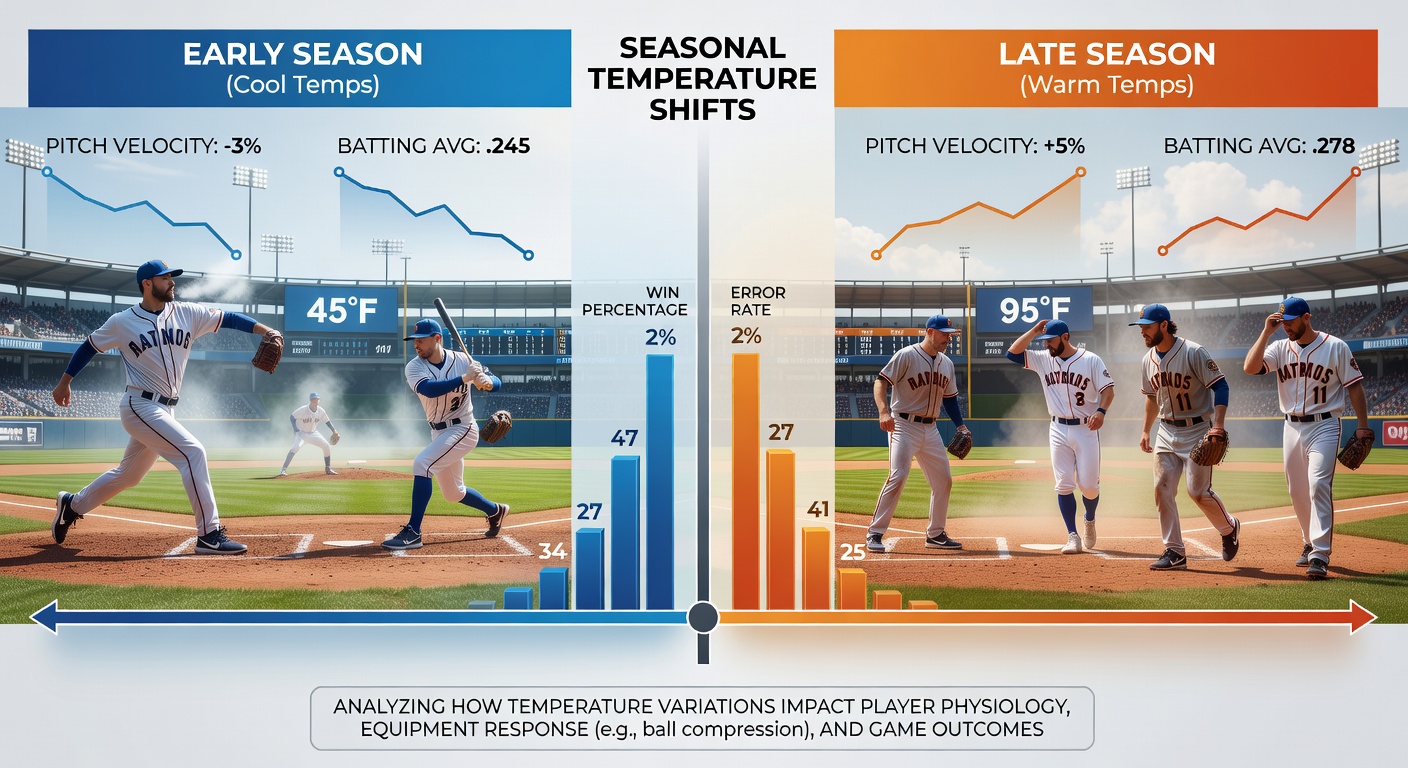
Heat stress affects reaction times and throwing accuracy, particularly for infielders and catchers who handle the ball repeatedly, and studies tracking error rates indicate upticks in miscues when games occur above 85 degrees with high humidity. Outfielders cover slightly less ground in sustained heat because fatigue sets in faster, which alters the outcomes of deep fly balls that might otherwise become outs. Pitchers show similar declines in command after the fifth inning under these conditions, prompting managers to shorten outings and rely more on bullpens that themselves post higher walk rates in elevated temperatures.
Adjusting Run Total Projections Across the Season
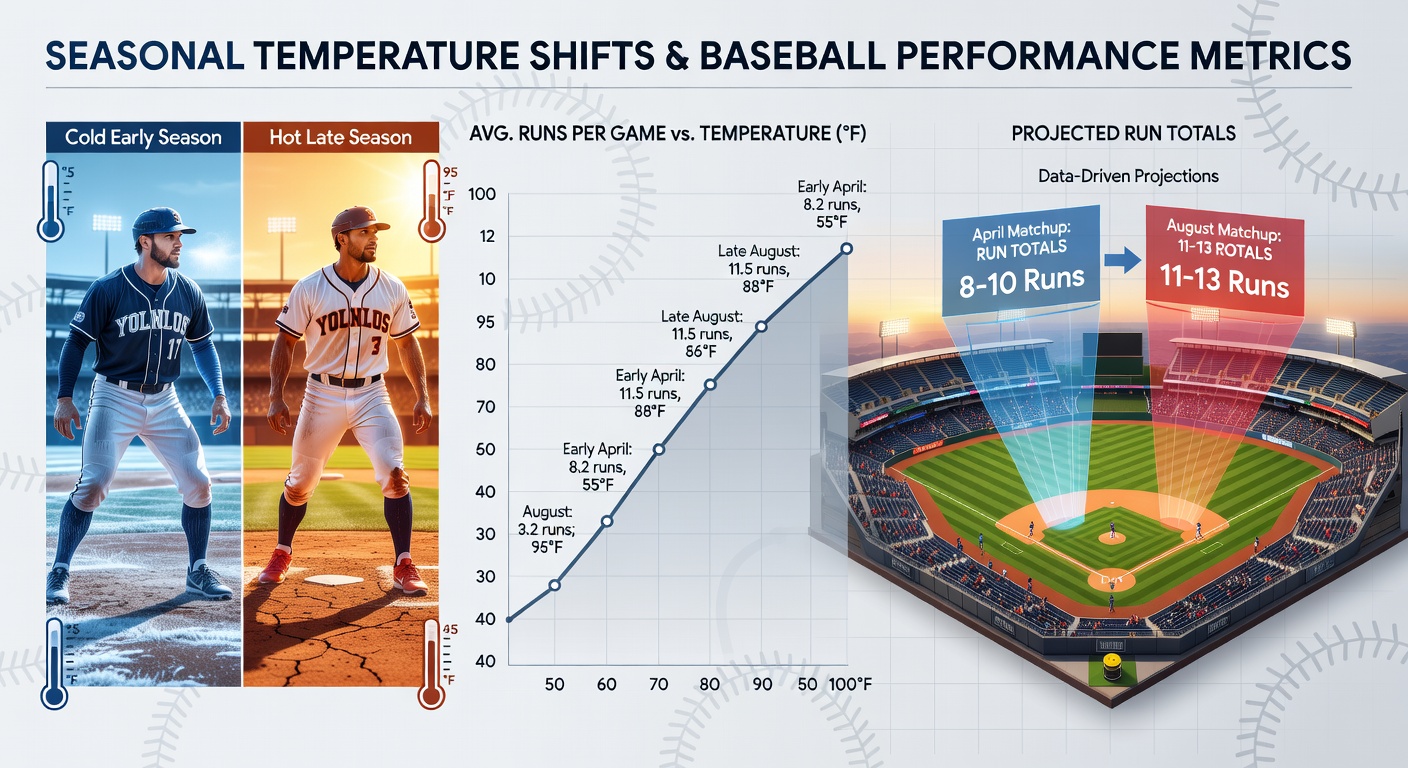
Projection models incorporate temperature forecasts because historical averages reveal that games played when temperatures sit between 60 and 70 degrees produce roughly 8.2 combined runs per contest, whereas those above 80 degrees average closer to 9.5 runs according to aggregated play-by-play records. In cooler late-season environments below 60 degrees, totals drop again as balls carry less distance and pitchers regain sharper movement on breaking pitches. Teams preparing for May 2026 series therefore consult detailed weather grids to refine over-under decisions, especially in venues like Coors Field where altitude already amplifies temperature-driven distance gains.
Matchup-specific factors compound these effects because left-handed hitters often gain more from warmer air when facing right-handed pitchers whose sliders lose bite, and analysts cross-reference player spray charts with venue temperature histories to identify favorable spots. Colder nights conversely favor ground-ball pitchers who keep the ball in the infield where defensive positioning remains more stable regardless of air density.
Regional and Monthly Variations in 2026 Data
Western division ballparks exhibit different temperature sensitivities than eastern venues because desert and mountain climates produce sharper daily swings, and records from early May 2026 already showed several high-scoring afternoons followed by lower-scoring night games at the same stadiums. Eastern humidity adds another layer because it further reduces air density while also accelerating player fatigue, resulting in more extra-base hits during humid stretches. Researchers comparing 2025 and 2026 datasets note consistent directional changes even as overall league scoring fluctuates year to year.
Advanced metrics such as exit velocity and launch angle remain relatively stable across temperatures, yet the distance those batted balls travel shifts enough to convert marginal fly balls into home runs during warmer periods. Defensive shifts and positioning data also adjust slightly because teams anticipate more balls finding gaps when temperatures rise.
Conclusion
Seasonal temperature shifts therefore serve as a quantifiable variable that alters both individual performance metrics and aggregate run expectations in professional baseball, and organizations continue to refine their models using real-time weather integration alongside traditional statistics. Those who monitor these interactions gain clearer insight into why certain matchups produce higher or lower totals depending on the calendar and the forecast.