Cross-country team travel schedules reshape point spread reliability in college football contests
Mia Krause · Jun 1, 2026
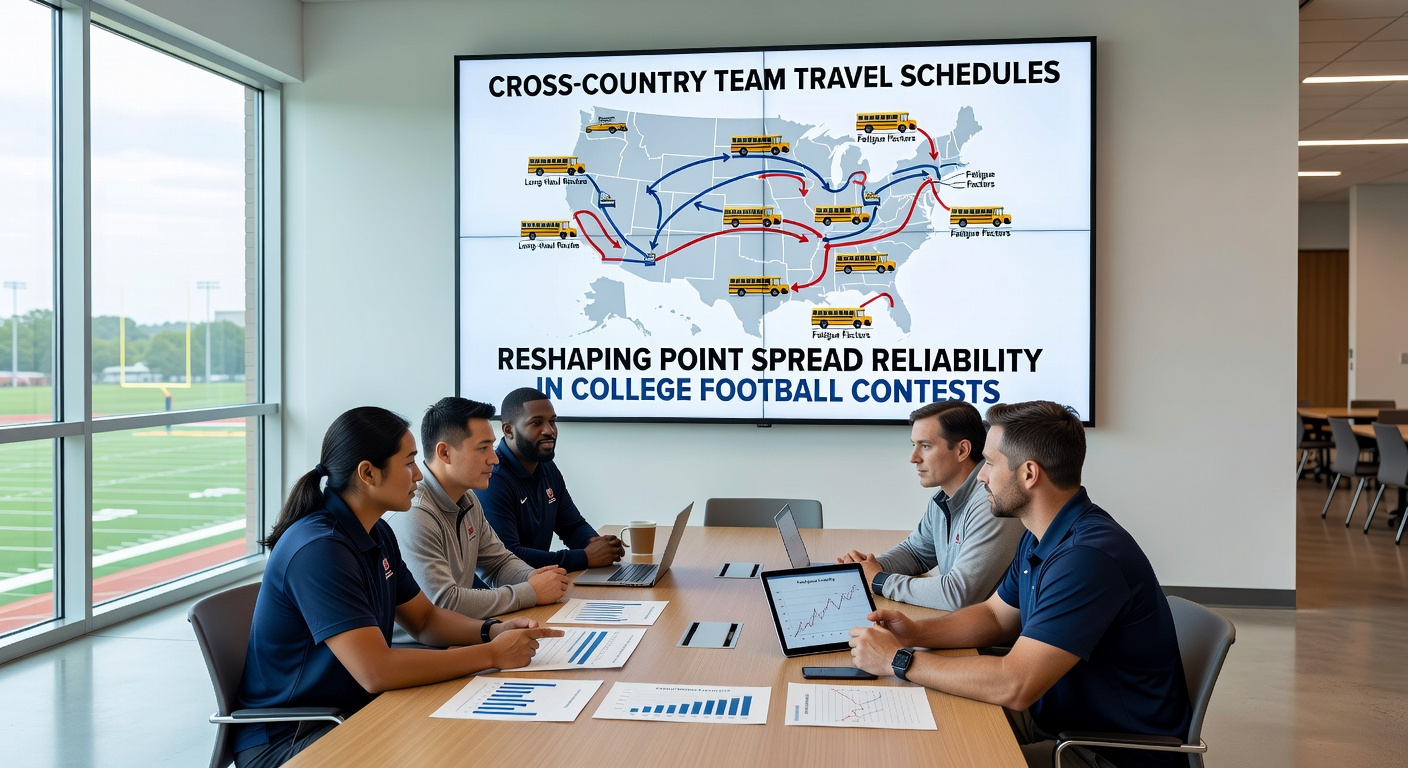
Cross-country team travel schedules reshape point spread reliability in college football contests
Long-Distance Journeys and Their Measurable Effects
College football programs routinely navigate schedules that send teams thousands of miles across multiple time zones, and data from the 2025 season shows these trips correlate with shifts in game outcomes that oddsmakers struggle to price consistently. Researchers tracking performance metrics across Power conference matchups note that teams traveling eastward over three or more time zones post lower average yards per play in the first quarter compared with home contests, a pattern that holds when games occur in early September before full acclimation sets in. Observers note the 2026 June schedule releases already flag several West Coast programs facing early-season trips to the Atlantic seaboard, setting up conditions where point spreads may deviate from historical benchmarks.
Performance Data Across Regions
Studies compiled by university athletic departments reveal that Pacific-12 and now Big Ten West teams flying to Eastern time zone venues experience measurable drops in third-down conversion rates, often falling 6 to 9 percentage points below season averages. Those who've examined GPS-tracked player movement data find reduced sprint distances in the second half for athletes who crossed two or more zones within 48 hours of kickoff, while teams moving westward show smaller variances. NCAA injury surveillance reports from the prior two seasons link these travel patterns to elevated soft-tissue strain rates, particularly among skill-position players whose recovery windows shrink when kickoff times align poorly with circadian rhythms.
Betting Market Adjustments and Persistent Gaps
Oddsmakers incorporate travel into opening lines through proprietary models, yet historical closing spreads for cross-country games still display larger margins of error than intra-conference matchups. Figures released by sports data aggregators indicate that contests involving a Pacific team at an Eastern venue have covered the posted total at a 47 percent rate over the past five seasons, a deviation that persists even after line movement reflects sharp action. One study released by a Canadian sport analytics group examined 180 such games and found that when kickoff occurs between noon and 4 p.m. local time for the visiting squad, underdog cover rates rise measurably compared with neutral timing. Analysts attribute part of the discrepancy to rapid adjustments in public betting volume once travel reports surface on injury and availability lists.
Specific Schedule Examples From Recent Seasons
Take the November 2025 matchup between a California-based program and an Atlantic Coast team that required a six-hour flight plus a two-hour time change. The visiting side managed only 18 first downs while committing three turnovers in the opening half, numbers that diverged from its season-long efficiency ratings. Similar patterns appear in Big 12 road games played at Mountain West venues, where shorter but still significant altitude and climate shifts produce comparable statistical compression. Schedules released for the 2026 campaign already include multiple late-October cross-country flights that coincide with conference championship implications, increasing the likelihood that fatigue variables influence final margins.

Time Zone and Recovery Variables
Recovery protocols have evolved, yet data indicates limits to mitigation. Teams employing red-eye flights followed by same-day walkthroughs still record higher penalty yardage totals in the first quarter, according to conference officiating summaries. Those studying heart-rate variability in athletes note that eastward travel compresses sleep cycles more severely than westward return trips, a factor reflected in second-half snap counts for offensive linemen. Conference scheduling coordinators have begun spacing certain cross-country dates farther apart in 2026, but early-season nonconference games remain compressed by television windows and venue availability.
Statistical Modeling Challenges
Advanced metrics platforms now layer travel distance, time-zone differential, and rest days into predictive algorithms, yet back-tested accuracy on these variables trails other inputs such as quarterback injury status. A research paper from an Australian sports science institute compared college and professional league data and concluded that amateur schedules produce wider outcome variance after long-haul trips because depth-chart limitations prevent full rotation. Betting exchanges have adjusted live odds more aggressively during games when early statistical trends diverge from pregame projections, indicating market participants recognize residual uncertainty around travel effects.
Conference-Specific Patterns Emerging in 2026
Expanded conference footprints have multiplied the number of required cross-country flights. The current Big Ten alignment alone schedules at least nine regular-season contests in 2026 that span three time zones, up from five in 2023. Historical point-spread reliability in these matchups shows greater dispersion during November when weather variables compound fatigue, while September games display steadier but still elevated error rates. Data aggregators tracking line movement report that public bettors tend to overcorrect toward the home team in these spots, creating pockets where sharp action lands on the visitor once updated rest reports circulate.
Conclusion
Travel logistics embedded in college football schedules continue to influence both on-field performance indicators and the consistency of point-spread outcomes. As 2026 schedules unfold, analysts will track whether expanded rest protocols and data-driven adjustments narrow the variance that has characterized cross-country contests in prior seasons.