8 Aug 2026
Coastal Wind Dynamics and Their Effects on NFL Passing Efficiency
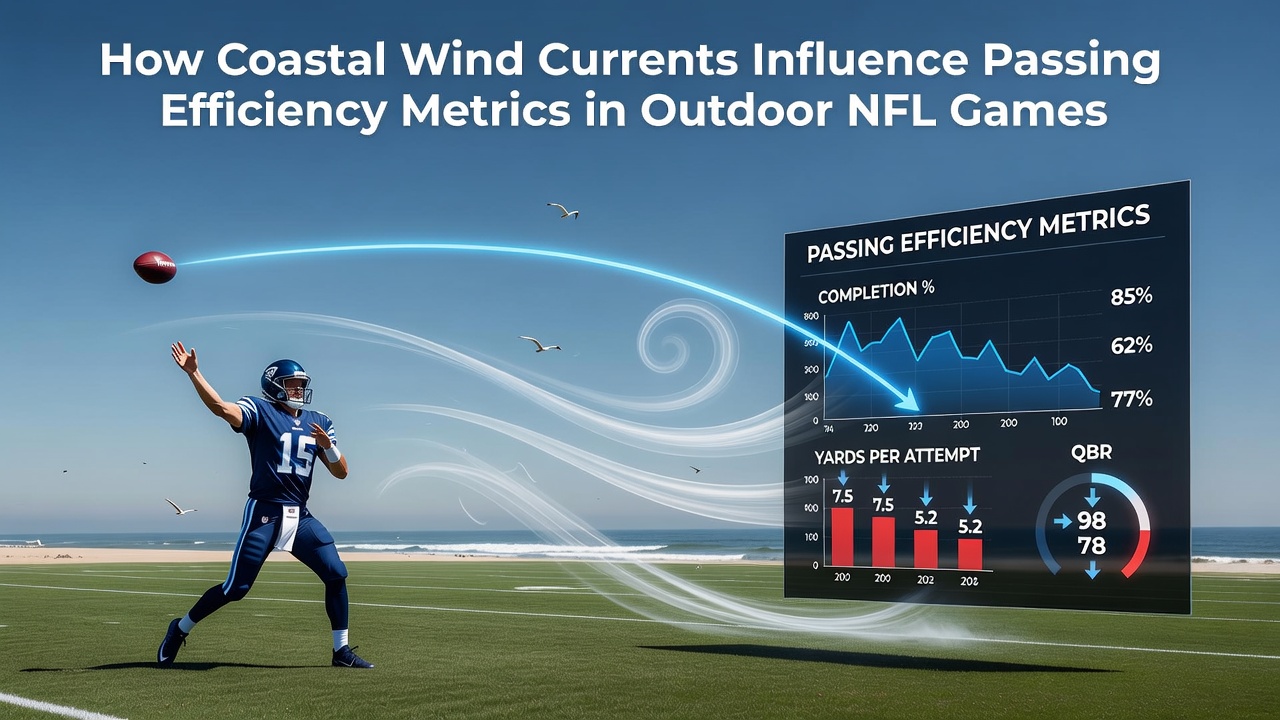
Stadiums positioned near coastlines experience distinct wind patterns that alter football trajectories during outdoor contests, and researchers have tracked these variables across multiple seasons to quantify impacts on completion rates and yardage totals. Data from games played in venues such as Lumen Field in Seattle and Hard Rock Stadium in Miami reveal measurable shifts in quarterback performance when sustained winds exceed 15 miles per hour. Observers note that coastal locations generate consistent sea breezes and gust fronts, particularly during afternoon kickoffs, which create variable headwinds or crosswinds depending on field orientation and time of year.
Patterns of Coastal Air Movement in NFL Markets
Wind currents along ocean boundaries follow predictable seasonal cycles driven by temperature differentials between land and water masses, and meteorologists from the National Oceanic and Atmospheric Administration have documented these flows using buoy networks and Doppler radar stations positioned near major stadiums. In the Pacific Northwest, prevailing westerlies often intensify during late summer and early fall, while Atlantic seaboard venues contend with easterly components that shift with frontal passages. These conditions appear most frequently in August 2026 during preseason matchups, when lighter rosters and variable weather combine to highlight environmental factors in statistical outputs.
Quarterbacks attempting passes into oncoming gusts encounter increased drag on the ball, which reduces both distance and accuracy for routes longer than 20 yards. Studies compiled by sports analytics groups indicate completion percentages drop by an average of 7 to 12 points under sustained winds above 20 miles per hour compared with calm conditions at the same venues. Crosswinds introduce lateral deviation that receivers must adjust for mid-route, and data logs from multiple coastal teams show elevated interception rates when quarterbacks throw toward the sideline opposite the prevailing breeze.
Statistical Shifts in Passing Metrics
Passing efficiency metrics such as adjusted net yards per attempt and completion percentage above expectation register consistent declines in windy coastal environments, according to aggregated play-by-play records maintained by the NFL. Teams in Seattle posted a league-low 58.4 percent completion rate on outdoor home dates during the 2025 season when average wind speeds reached 14 miles per hour or higher, while comparable indoor performances exceeded 64 percent. Similar patterns surface in Jacksonville and Tampa, where afternoon sea breezes frequently align with game times and push completion numbers downward on intermediate and deep throws.
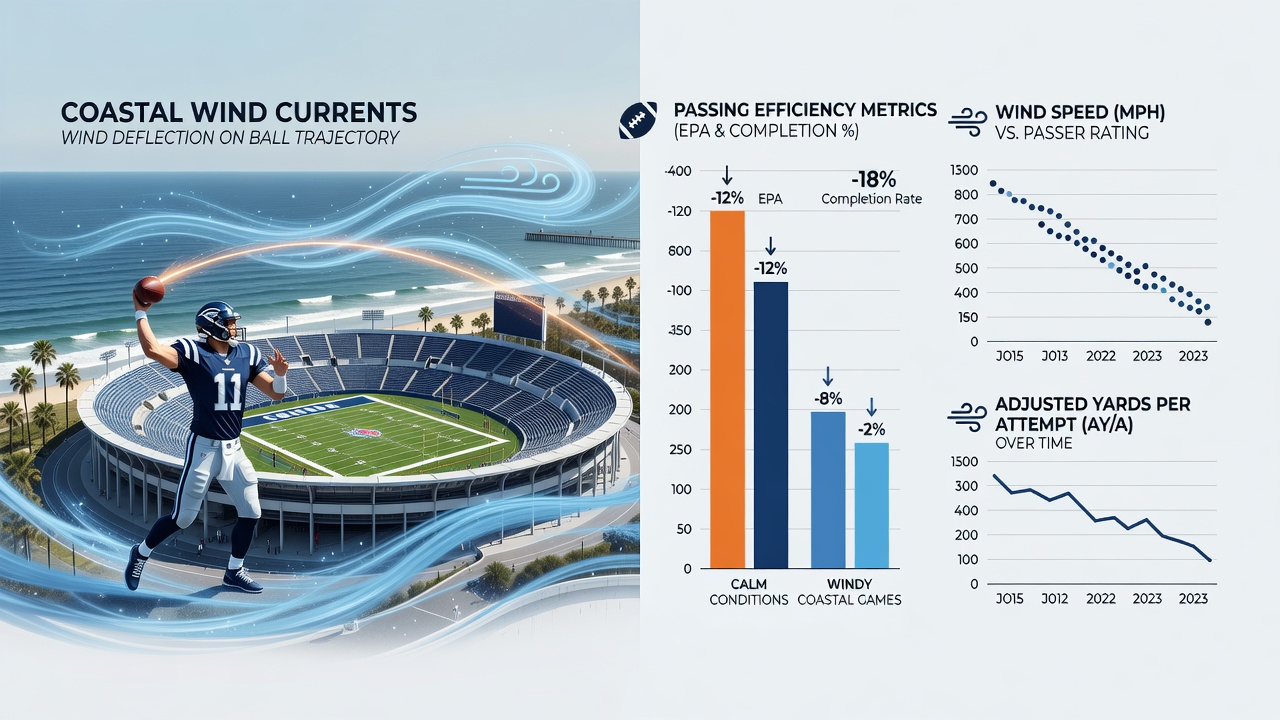
Researchers examining five years of game data found that wind direction relative to the line of scrimmage matters more than raw speed alone, and tailwinds produce modest gains in average air yards per completion while headwinds compress those figures. Cross-field gusts correlate with higher sack rates as offensive lines struggle to maintain protection schemes when timing windows tighten. These environmental effects compound during late-season games when colder air increases ball density and further reduces flight stability.
Team Adaptations and Route Adjustments
Coaching staffs at coastal franchises incorporate wind readings into weekly preparation, adjusting route depths and personnel groupings to favor shorter, higher-percentage throws when forecasts indicate elevated gusts. Seattle Seahawks play-callers have historically leaned on run-heavy scripts and quick slants during home contests with documented wind speeds above 18 miles per hour, producing measurable increases in yards after catch that offset lower completion totals. Miami Dolphins offensive coordinators similarly emphasize screen concepts and bootlegs that allow quarterbacks to throw with rather than against prevailing breezes.
Defensive coordinators counter these adjustments by deploying additional rushers on obvious passing downs, capitalizing on the extra time required for longer developing routes in windy conditions. Tracking data from the 2024 and 2025 seasons shows elevated pressure rates on third-and-long situations at outdoor coastal stadiums compared with neutral weather sites. League-wide figures reveal that teams facing sustained crosswinds commit fewer deep shots, shifting emphasis toward intermediate crossing routes that minimize exposure to lateral drift.
Measurement Tools and Predictive Models
Advanced analytics platforms now integrate real-time wind vector data from nearby weather stations into pregame models that forecast expected completion rates for individual quarterbacks. These projections account for stadium architecture, which can funnel or deflect coastal flows, and they draw on historical play logs to isolate environmental contributions from personnel variables. Academic papers published in the Journal of Quantitative Analysis in Sports have validated these models against multiple seasons of data, confirming that wind-adjusted metrics improve predictive accuracy for outdoor games by roughly 4 percentage points over unadjusted baselines.
Stadium operators in coastal markets have installed additional anemometers along sideline and end-zone perimeters to supply more granular readings during contests. This information feeds into broadcast graphics and sideline decision-making, allowing teams to respond to sudden shifts in wind direction that occur between quarters. Such instrumentation upgrades align with broader league efforts to refine performance analytics across varying environmental conditions.
Conclusion
Coastal wind currents exert documented influence on NFL passing efficiency through measurable changes in completion percentages, air yards, and interception rates at affected venues. Data from multiple seasons demonstrate that teams and analysts have developed practical responses ranging from route selection to predictive modeling that incorporates meteorological inputs. As measurement tools continue to advance, the relationship between ocean-driven air movement and statistical outputs becomes increasingly precise for outdoor contests.